I am seeing this timeout happen quite a lot recently when querying the Referral table, attempting to grab 1000 records at a time. Lots of this: “Transport error occurred: cURL error 28: Operation timed out after 60000 milliseconds with 0 bytes received”. This happens randomly to other tables, but the referral table seems to happen quite frequently.
Before the move away from Mashery I almost never saw this timeout reached, only since the change to Apigee have I been seeing it happen and happen frequently.
I am working on the best way to increase the Guzzle curl timeout to match the 300 seconds Apigee is supposedly configured for, but I am not sure why requests are timing out more since the change? Is the API via Apigee no longer capable of delivering a request for 1000 records in a timely manor?
Edit: Checking the usual time a successful request of 1000 referrals takes, and it appears to happen in about an average of 0.5 to 1 seconds to complete, so for some reason it is just not returning a response within 60 seconds. Attempting to increase the guzzle timeout to see if it takes the full 300 seconds or what.
The backend providing the response did not change. Apigee is just providing the authentication and proxying the request to one our our backend apps. Depending on which app you are hitting on the backend can determine latency of calls. An app that is under heavy load can take a long time to return if it returns at all. If you have an app name you are hitting and a timeframe I can dig around our logs to see if I see anything going on.
I did manage to adjust the guzzle request timeout on our end and logged the time of each call for a few hours, it does appear that sometimes calls can take over 60 seconds to respond, one took 111 seconds. So yeah, it appears that occasionally our app is under load (not sure anything special was happening during that 111 second one, but who knows).
It is possible I am noticing this more since I have extended our logging and have been watching it more closely since the switch to Apigee initially was having some issues.
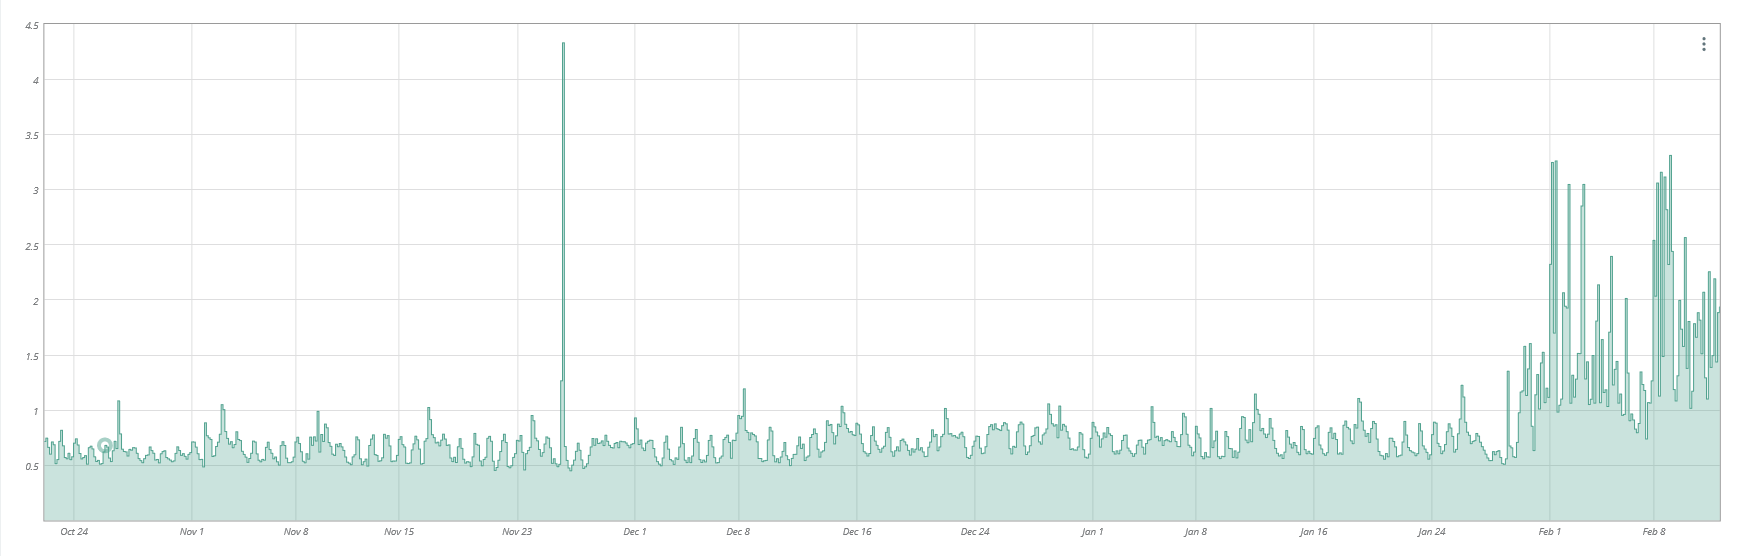
The vast majority of API calls take under 1 second, but since 01/30/2020, we are seeing many that take 200+ seconds which is pushing the average way up.
I have getting data together for your ticket, but I wanted to clarify a few thing. We have actually been putting all API calls through Apigee since the beginning of December. However the end of January was around when we finally cutover token generation from Mashery to Apigee. The latency Apigee introduces is very small. The latency increases you are seeing is most likely coming from our backends. I am tracking down to see if there were any changes to our backends around the time the response times in your graph went up. This could also be tenant specific. Are you accessing more than one tenant (a Keap customer) or are all your calls hitting a single tenant. If this is going against a single tenant then it is possible this tenant started to struggle or is being affected by a noisy neighbor. If you know what tenant/s are having the highest latency I would love to get that data. Also I would love to get your client_id so I can pull more specific logs. The following are the latencies Apigee introduced from Jan 28th - Feb 3rd across all tenants:
We don’t have the same data tracking for each call as Randy, but I am seeing calls here and there taking 300+ seconds (timeouts) as well as 503 errors occasionally. As mentioned previously, I did record the times of the calls for a brief period and most are 0.5 to 1 seconds, but here and there take longer or don’t respond.
I have adjusted my code to retry the call right away when encountering a timeout or 503 and so far all of the retries have succeeded. At this point I am unsure if the performance is different than a few months ago, we didn’t have as close of logging on our calls and errors as we do now.